

Tanzania’s Vision 2025 continues to be the guiding beacon of all our future developmental efforts summarized broadly as being:- High quality livelihood including the absence of abject poverty.- Good governance and the rule of law.
Strong and competitive economy. The goals of our Vision 2025 are in line with the United Nations’ Millennium Development Goals with MKUKUTA as the main vehicle of implementation.
Yet at this point in our history, problems especially in rural areas are many and daunting. Social and economic services require sustainable improvement. The high primary school enrollment rates recently attained have to be maintained; the food situation is still precarious; infant and maternal/mortality rates continue to be high. Unemployment is still triggering mass migration of youth from rural areas to already overcrowded urban centers.
Added to these problems in the menace poised by HIV/AIDS, the prevalence of which throughout Tanzania is negating our efforts to advance into this century of science and technology. The pandemic has been exacting a heavy toll on the economically active age group, leaving in its wake an increasing number of orphans, broken families and much suffering. AIDS together with environmental deterioration are the new developmental problems. They cannot be ignored.
Our efforts to meet both the new and the old challenges have been hampered by many factors including ill prepared rural development programmers followed by weak implementation, monitoring and supervision of these programmed and sectoral strategies. The shortcomings in policy formulation, project identification, design and implementation is in turn balanced on the lack of reliable and adequate data and information on the rural development process.
The publication of the Regional Socio-economic Profile series by the Ministry of Planning, Economy and Empowerment, in collaboration with the National Bureau of Statistics and various regional commissioners’ offices is a major attempt at finding a solution to this data and information gap.
Regional profiles cover a wide range of data and information on geography, population, socioeconomic parameters, social services, economic infrastructure and the productive sectors. Such data and information has proved vital to many policy makers, planners, researchers, donors and functional managers.
This Itilima Socio-economic Profile contains the detailed data and information on the region and is one of the Second Edition series nationwide. The second editions take advantage of experience gained in the production of the First Edition publications. They are proving even more valuable and informative to our clients. Constructive view and criticisms are still invited from readers to enable such profiles to become a better tool in the implementation of the country’s policies.
Last but not least, I wish to thank the staff of the council, Stakeholders, the National Bureau of Statistics and the Itilima District Commissioner’s Office, for their commitment in ensuring the successful compilation of this document
CHAPTER 0NE
VISION, MISSION AND CORE VALUES
VISION
A council with strong economic base that community participation in provision of better and equitable services delivery in harmonized condition
MISSION
To provide high quality social economic services to the community through efficient and effective use of resources and good governance for improving standards
CORE VALUES
The core values identified are as follows
Capable of coping with changes at any challenges
Proper use of available resources
Enhanced community participation
Team work among stakeholders
Good governance
High commitment in service delivery
KEY RESULTS AREAS
Under the guidance of vision and mission of the District Council, people are expecting to see the results of public services reform in the following areas;
Enhancing suitable economy
Good social and economic services
Community participation in identifying their development priorities in the council.
Proper utilization of public resources
Good governance in place
Enhancing peace and security
Enhancing sustainable utilization of natural resources and environmental management
Enhancing financial management and accountability
Enhancing human capital development
Improved preparedness and disaster management
LAND, PEOPLE AND CLIMATE
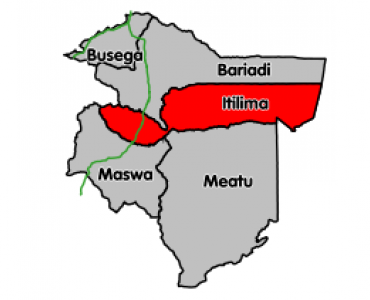
Itilima District is one among five Districts of Simiyu Region. The District is bordered by Busega District in the West, Bariadi District in the North, Meatu and Maswa Districts in the South and Ngorongoro District (Arusha Region) in the East. Geographically the District is located at latitude 3○44′0″ South of Equator and at longitude 33○29′0″ East of Greenwich.
The District cover the total area of 2,647.7 Sq.kms (264,770 ha) of which 1,938.70 Sq.km (193,870 ha) is covered with arable land suitable for agriculture and livestock keeping, 640 Sq. km (64,000 ha) is covered by the Maswa Game Reserve and the remaining area of 69 Sq. kms (6,900 ha) is covered by water streams, shallow bushes and hilly area.
Fig1: Land classification in Itilima District Council
Administratively, Itilima District is divided into 4 divisions namely Kanadi, Bumera, Itilima and Kinang’weli, 22 wards, 102 villages and 581 hamlets. However Itilima District has one constituency namely Itilima Constituency.
Administrative Structure of Itilima District
| Division | Area Km2 | Number of | |
Ward | Village | ||
| Bumera | 698.3 | 6 | 26 |
| Itilima | 592.1 | 4 | 22 |
| Kanadi | 649.0 | 6 | 26 |
| Kinang’weli | 708.3 | 6 | 28 |
| Total District | 2647.7 | 22 | 102 |
Distribution of Wards and Villages by Division, Itilima District
Distibution of Area in Km2 by Division, Itilima District
ETHNICITY
Itilima is inhabited mainly by one tribe, the Sukuma. The Sukuma people of Itilima are known as Ntuzu. Other tribes found in Itilima District include Nyiramba, Kurya, Kerewe, Zanaki, Waha and Nyamwezi.
POPULATION SIZE AND LABOUR FORCE
According to the 2012 National household and Population Census reports, Itilima District has a population of 313,900 of which 165,398 are Females and 148,502 are Males. In 2012 a man power was estimated to be 112,966 (Aged between 18-60 years). There are 43,597 households with average of 7.2 household size and an incremental rate of 1.8% per year.
Population Distribution by Sex, Itilima District
Table: Population distribution by sex
| Division | Population | |||
| Male | Female | Total | % | |
| Bumera | 38484 | 43460 | 81944 | |
| Itilima | 30847 | 34055 | 64902 | |
| Kanadi | 39969 | 45718 | 85687 | |
| Kinang’weli | 39202 | 42165 | 81367 | |
| Total District | 148,502 | 165,398 | 313,000 |
|
Population Distribution Disionwise by Sex.
Age group and sex distribution,Itilima district
| Male | Female | Total | |
| 0- 4 | 32,458 | 32,277 | 64,735 |
| 5-14 | 51,441 | 51,179 | 102,620 |
| 15-44 | 49,127 | 63,842 | 112,969 |
| 45-64 | 10,912 | 12,660 | 23,572 |
| 65+ | 4,564 | 5,440 | 10,004 |
| Total | 148,502 | 165,398 | 313,900 |
Fig. Age group and sex distribution, Itilima district.
CLIMATE
The climate of the District is generally of a tropical type. The annual rainfall ranges from 700mm-950mm pa. There are two periods of rain seasons. The short rain period (vuli) is normally between October-December. Long rain period (masika) falls in between March to mid May. The period from June to September is hot and dry. The average temperature ranges from 290 C during day time and 190 C at night.
DRAINAGE SYSTEM
Livestock keeping is the second predominant economic activity which if properly exploited can contribute significantly to the district’s economy. The cattle population which is made up of indigenous breed is kept as evidence of personal wealth and prestige in a traditional way. Beside cattle, goats and sheep rearing are major activities in Itilima district.
Industries, beekeeping, trade and fishing activities are carried out at a small scale in a district.
PRODUCTIVE SECTORS
AGRICULTURE
Agriculture is the predominant economic sector in Itilima District. It is dominated by smallholder farmers in all 102 villages of the District. The bulk of agricultural production come from smallholder farmers who employ very little capital. The main inputs are labour and land. Currently farmers are encouraged to adopt advanced tools and modern methods of agriculture.
Tractors, power tiller and plough are implements highly encouraged in the district.
Table 13: Agriculture Implements by 2013/2014
Tractor | Power tiller | Plough | Oxcart | Weeding hoes | Rippers | Planters | Oxen |
| 75 | 28 | 13,031 | 118 | 2100 | 3 | 5 | 54,706 |
Major food crops and cash crops produced in the region include maize, paddy,millet sorghum and cotton. The production of these crops for the year 2013/2014 is as shown in the tables below.
Table 15: Food crops
| Crops | Expected area (ha) | Area cultivated (ha) | Expected production (T) | Actual production (T) |
| Maize | 44,110.8 | 41,310.3 | 87,860 | 77,500 |
| Millet | 16,703 | 14,576 | 24,490 | 13,700 |
| Paddy | 12,807 | 9,890 | 21,009 | 17,200 |
| Sweet potato | 13,158.9 | 11,350 | 27,306.6 | 23,350 |
| Cassava | 2,366.1 | 957 | 7,169.9 | 3,150 |
| Sorghum | 204.2 | 87.5 | 115.9 | 49.2 |
| TOTAL | 89,350 | 78,170.80 | 167,951.4 | 134,949 |
Table 16: Cash crops
| Crops | Expected area(ha) | Area cultivated(ha) | Expected production(T) | Actual production(T) |
| Cotton | 39,324.9 | 35,656.7 | 45,787.1 | 27,042.29 |
| Groundnuts | 6,143.9 | 5,354.4 | 6,617.3 | 6,142 |
| Sunflower | 6,595 | 4,957.6 | 7,102.8 | 6,870 |
| TOTAL | 52,063.8 | 45,968.7 | 59,507.2 | 40,054.2 |
|
Expected area(ha)
|
Area cultivated(ha)
|
Expected production(T)
|
Actual production(T)
|
|
|
|
|
|
|
|
|
|
|
|
|
|
|
|
|
|
|
|
|
|
|
|
|
|
|
|
|
|
|
| Crop
|
Expected area (ha)
|
Seeds (T)
|
Fertilizer (T)
|
Expected Production (T)
|
| Maize
|
44,111
|
441
|
11,028
|
93,816
|
| Millet
|
16,703
|
417.5
|
2,088
|
28,064
|
| Paddy
|
12,807
|
256
|
1,601
|
21,206
|
| Sweet potato
|
13,159
|
164,488 (Bags)
|
-
|
31,659
|
| Cassava
|
2,366
|
29,575 (Bags)
|
-
|
17,727
|
| Sorghum
|
204
|
4
|
-
|
269
|
| Total
|
89,350
|
|
9,207
|
192,741
|
Food Crops
The tables below show the expected crops and land area to be produced and cultivated respectively and other agriculture inputs needed for the year 2014/2015
For the year 2014/2015 Itilima District is expecting to produce 192,741 tons of cereal and root crops, 24,136 tons of legumes and 66,198.5 tons of cash crops.
|
Expected area (ha)
|
Seeds (T)
|
Fertilizer (T)
|
Expected Production (T)
|
|
|
|
|
|
|
|
|
|
|
|
|
|
|
|
|
|
|
|
|
| Food
|
Estimate(tons) |
Actual (tons) |
|
Cereals |
68,932 |
37,259 |
|
Legumes |
22,977 |
5,258 |
Reasons for Investing in Itilima District Council
INVESTMENT OPPORTUNITIES
More efforts is being emphasized on potential investors to establish both medium and large scale manufacturing industries
In Itilima district there are small scale industries dealing with processing of cooking oil from sunflower seeds, cotton seeds, cotton cakes and ground nuts.
Manufacturing is a process which involves tools and labor to produce goods for use or sale. The term may refer to a range of human activities, from handcraft to high technology, but is most commonly applied to industrial production, in which raw materials are transformed into finished goods on a small and large scale. Such finished goods may be used to manufacture other more complex products, such as aircraft, household appliances or automobiles, or sold to wholesalers, who in turn sell them to retailers, who then sell them to end user – the consumer.
MANUFACTURING
Beekeeping is also practiced and is the growing source of income to the residents of Itilima and also is one of major ways in conserving forests and environments at large. There are total of 1095 beehives including 364 traditional and 731 modern beehives. The expectation is to harness 1302 liters of honey and 12Kg of wax. This is done through working hand-in-hand with District council, Itilima residents, World vision and Lake Victoria Environment Management Program (LVEMP II).
Itilima District conserves environments and reserves both natural and artificial resources. Through working hand-in-hand by District council, Partners and citizens managed to sort areas within villages as Forest and Game reserves. The area of 27,414 ha is reserved around the villages of Migato, Shishani, Longalombogo and Mwanhunda. Meanwhile there are two gardens which is used for nursery trees in Ngeme and Ng’hesha village. The district has taken the charge of planting trees in order to conserve the environments where by 132,567 of trees were planted in the year 2013/2014.
NATURAL RESOURCES
| Cattle
|
Goats
|
Sheep
|
Dogs
|
Poultry
|
Donkeys
|
Total
|
| 296,322
|
100,220
|
48,177
|
13,752
|
206,086
|
89
|
664,646
|
Table19: Estimated Livestock Population in Itilima District, 2014
Livestock keeping is the second predominant economic activity in Itilima District.The district collectively has a number of livestock and residents of Itilima consider livestock keeping as one of their source of income. Lack of enough experts and personnel on this sub sector has become the most prominent challenge facing it. The district has only 20 livestock officers with a deficit of 111 livestock officers who are needed.
LIVESTOCK
| TYPES OF ASSOCIATION
|
NUMBER OF ASSOCIATIONS
|
| SACCOS
|
22
|
| Livestock Keepers Association
|
10
|
| TOTAL
|
32
|
Table: Association
COOPERATIVE SECTOR.
|
|
|
|
|
|
|
|
|
|
|
|
|
|
|
|
|
|
|
|
|
|
|
|
|
|
|
|
|
|
|
|
|
|
|
|
2.6.3 Other Investment Opportunities
The following are measures taken by the council to control truancy in primary schools:
| YEAR
|
GIRLS ENROLLED
|
GIRLE PREGNATED
|
% PREGNATED
|
| 2011
|
80,987
|
8
|
0.01
|
| 2012
|
78,855
|
5
|
0.01
|
| 2013
|
28,995
|
3
|
0.03
|
The rate of truancy in the council is 0.2 % which is caused by some people who shift their settlement in order look for pasture for their cattle and others are involved in small business. The below illustrate the situation from the year 2011 to 2013.
The situation of truancy in primary schools:
| ALLOCATED
|
REPORTED
|
% REPORTED
|
NOT REPORTED
|
% NOT REPORTED
|
| 373
|
346
|
93
|
27
|
7
|
Bariadi district council in the year of 2013 expected to recruit 373 grade III A teachers while the teacher who reported were 346 only equivalent to 93 % as shown on table No 5 below :
Recruitment of teachers in primary schools:
| YEAR
|
CANDIDATE
|
PASSED
|
% PASSED
|
SELECTED FORM I
|
%SELECTED FORM I
|
FAILED
|
% FAILED
|
| 2012
|
9,261
|
2,544
|
27.5
|
2.544
|
100
|
6,717
|
72.5
|
| 2013
|
4,270
|
1,434
|
33.6
|
1,434
|
100
|
2,836
|
66.4
|
Table Na. 4 Primary School leaving examination results and student selected to join form one (1) from 2012 to 2013:
| TYPES
|
REQUIREMENT
|
AVAILABLE
|
SHORTAGE
|
% OF SHORTAGE
|
| Classrooms
|
1503
|
489
|
1,014
|
67
|
| T/Houses
|
1,403
|
285
|
1,118
|
80
|
| Toilet-pits
|
2,617
|
358
|
2,259
|
86
|
| Offices
|
152
|
135
|
17
|
11
|
| Stores
|
210
|
27
|
183
|
87
|
| Desks
|
17,112
|
4,635
|
12,477
|
73
|
| Tables
|
2,307
|
611
|
1,696
|
74
|
| Chairs
|
2,358
|
771
|
1,587
|
67
|
| Cardboard
|
1411
|
639
|
772
|
55
|
| Shelves
|
495
|
39
|
456
|
92
|
| Water Tanks
|
124
|
19
|
105
|
85
|
In actual fact the council is facing a huge problem of inadequate infrastructures in primary schools, to overcome this problem the council is on the process to co-operate with the community and other stake holders. Table number 3 shows the real situation.
Infrastructure in primary schools:
|
|
BOYS
|
GIRLS
|
TOAL
|
%
|
| Expected
|
2,764
|
2,875
|
5,639
|
100
|
| Enrolled
|
2,396
|
2,617
|
5,017
|
89
|
| Not Enrolled
|
368
|
258
|
626
|
11
|
Table: Enrolment in standard I in 2013.
Bariadi district council makes sure that all aged school children are enrolled in standard one and continuer up to standard VII. The table number 2 below shows the real situation of standard one enrolment in the year of 2013.
STANDARD ONE (I) ENROLMENT
The council enrolled total number 56,507 pupils in those 70 schools including 27,512 boys and 28,995 girls.
Bariadi district council has a total number of 70 primary schools; both are owned by public, the council has no primary school owned by privet sector.
PRIMARY EDUCATION
Bariadi district council has a total number of 69 pre-primary classes owned by public , these case have a total number 7,241 pupils out of them boys are 3,514 and girls are 3,727.
PRE- PRIMARY EDUCATION ENROLMENT
EDUCATION SECTOR
Delay in disembarsement of fund.
Inadequate staff housing that is as a result of inadequate funding for implementation of development of sectral infrastructures.
Recurrent stock-out of drugs and medical equipments by 70%
Inadequate health facilities by 60%
Shortage of skilled HRH by 65.4%
CHALLENGES FACING THE HEALTH SECTOR
A total of 2,920 treated mosquito nets were provided by the end of October 2013 to mothers attending ANC.
By the end of October 2013, a total of 5 deaths of children under five and 3 deaths of above years of age were reported from different facilities in the council.
IPD attendance had 644 children under five and 322 above five years of age.
For the period of January October 2013, OPD attendance had 6,921 children below five years of age and 5,975 above five years of age clients which accounted for 38% of the total OPD attendance in all facilities.
MALARIA SITUATION
Clients who are on ARVs has increased to 573 until October 2013. In general, until November 2013 HIV/AIDS prevalence was at 3.7% compared to 5.1% of 2007.
Up to October 2013, a total of 8,422 clients appeared for VCT and 120 out of them were found positive which accounted for 1.2%. The number of orphans due to HIV/AIDS up to October 2013 was 3,153 which is equal to 35% of the vulnerable children.
| YEAR
|
PERCENTAGE (%)
|
| 2009
|
6.7
|
| 2010
|
6.9
|
| 2011
|
3.0
|
| 2012
|
5.9
|
| October, 2013
|
3.7
|
HIV/AIDS SITUATUATION
Up to November 2013, immunization coverage has reached 96% of the targeted number of children of 162,197.
Under five services have also improved where by mortality rate had reduced from 2/1000 live birth in 2009 to 12 deaths which is equivalent to 1/1000 live birth until November 2013.
ANC attendance up to October 2013 was at 97% (12,972 women), while facility deliveries stood at 34% (4,559). Family planning coverage increased to 16% which is equal to 3,789 mothers.
There has been an improvement in maternal and child health services in the council. Up to October 2013, data shows 1 maternal mortality which is equivalent to 7.4/100,000 live birth compared to the national data of 454/100,000 live birth.
MATERNAL AND CHILD HEALTH SERVICES
| HEALTH FACILITY
|
COUNCIL RATIO
|
NATIONAL RATIO
|
| RURAL HEALTH CENTRE
|
1:133,648
|
1:50,000
|
| BEDS AT HEALTH CENTRE
|
1:8744
|
|
| DISPENSARY
|
1:12,728
|
1:10,000
|
| MEDICAL DOCTORS
|
1:267,296
|
1:48,000
|
FACILITY BED CAPACITY RATIO AGAINST HEALTH WORKERS (MEDICAL DOCTORS)
Staff housing in most health facilities, especially those located in rural areas is still a big challenge facing the health sector in the council that hinders implementation of some activities like allocation of staff.
| KADA
|
REQUIREMENT
|
AVAILABLE
|
DEFICIT
|
| MEDICAL DOCTOR
|
3
|
1
|
2
|
| ASST. MEDICAL DOCTOR
|
6
|
3
|
3
|
| HEALTH SECRETARY
|
4
|
3
|
1
|
| CLINICAL OFFICER
|
30
|
13
|
17
|
| CLINICAL ASISTANT
|
42
|
10
|
32
|
| ASST.NURSING OFFICER
|
50
|
9
|
41
|
| NURSES
|
50
|
22
|
28
|
| MEDICAL ATTENDANT
|
60
|
23
|
37
|
| SOCIAL WELFARE OFFICER
|
1
|
1
|
0
|
| ASST. DENTAL OFFICER
|
3
|
1
|
2
|
| PERSONEL SECRETARY
|
1
|
1
|
0
|
| MEDICAL RECORD
|
1
|
1
|
0
|
| LAB TECHNOLOGIST
|
4
|
4
|
0
|
| ASST/LAB TECHNOLOGISTY
|
24
|
6
|
18
|
| ASST HEALTH OFFICER
|
16
|
5
|
11
|
| HEALTH ASST
|
6
|
1
|
5
|
| PHARMACIST
|
2
|
0
|
2
|
| PHAMACETICAL TECH
|
5
|
0
|
5
|
| OPTOMETRICIAN
|
5
|
0
|
5
|
| DENTAL SURGEON
|
2
|
0
|
2
|
| RADIOGRAPHER
|
5
|
0
|
5
|
| TOTAL
|
320
|
104
|
216
|
Health sector is still facing a deficit in human resource for health. As per this year, the sector has a total of 104 skilled health workers, leaving a gap of 197 health workers that are needed. The table below shows availability of human resource for health;
AVAILABILITY OF STAFF
| OWNERSHIP
|
HOSPITAL
|
HEALTH CENTRE
|
DISPENSARY
|
| GOVERNMENT
|
0
|
3
|
27
|
| FAITH BASED ORGANIZATION
|
0
|
1
|
1
|
| TOTAL
|
0
|
4
|
28
|
The district has 0 hospital, 3 government health centers, 1 FBO health centre, 27 government dispensaries, 1 private dispensary, 1 FBO dispensary and 1 armed force dispensary. In general, the council has 32 health facilities as it is shown in the table below;
AVAILABILITY OF HEALTH FACILITIES
HEALTH SECTOR
CHAPTER FOUR
Most of the population depends on firewood/charcoal and kerosene as their major sources of energy. There are few villages in the district have access to electricity, Lagangabilili, Luguru, Budalabujiga, Nyamalapa, Mwamapalala, Bumera, Laini, Nanga, Migato and Nkoma to mention few. The Government through Rural Electricity Agency (REA) is making great effort to facilitate more villages with access to electricity.
Major Sources
Energy
Itilima District Council telecommunication system has 4 telephone lines these are Airtel, Vodacom, Tigo, Halotel. Currently there is neither post office nor financial institutions but more effort is put to invite and attract these institutions
Telecommunications
| S/No
|
Descriptions
|
Kms
|
| 1.
|
Trunk roads
|
46
|
| 2.
|
Regional roads
|
36
|
| 3.
|
District roads
|
225
|
| 4.
|
Feeder roads
|
409
|
| Total
|
716
|
|
Distribution of roads in Itilima District Council
Itilima District Council has a road network of 692.3 Km including 53.68 Km of Regional roads, 227.9 Km of District roads (collector roads), 390.72 Km of District roads (feeder roads) and 20 Km of Urban roads categorized into four main groups namely Trunk, Regional, District and Feeder Roads. The distribution of these kilometers is 46kms, 36kms, 225kms and 409kms for Trunk, Regional, District and Feeder roads respectively.
Roads
ECONOMIC INFRASTRUCTURE
CHAPTER THREE
It is the aim of the Itilima to reduce the level of poverty as shown below in ACTION TAKEN BY THE DISTRICT COUNCIL TO EMPOWER COMMUNITY ECONOMICALLY.
On the whole, there do not appear to be large differences between poor households and the rest of the population in the distance to basic social services. Primary schools and health centers are reasonably equitably distributed. The poor have further to travel to drink water, but differences in the average distances are not large.
Poor households are more likely to depend on an unprotected source of drinking water, and less likely to have piped water, than households that are not poor. They are also less likely to use a toilet and to have an electricity connection.
The poor do not report higher levels of illness and injury; in children the reverse is the case. It may be that this is due to different perceptions of illness in the different groups. When they are ill, the poor are somewhat less likely to see a health provider. This means that they will benefit less from public expenditure on health than the rest of population, although the differences in the use of health services are not large.
Looked at the relationship between social sector indicators and poverty. Poor households were much less likely than other to send their children to school. These differentials have increased over the decade- while the enrolment of the children in households that are not poor has increased; enrolment has fallen for the poorest households. In the future, these children may then go on to be uneducated household heads, which are particularly likely to be poor, creating a cycle of poverty that the education system has failed to break.
Not all groups have benefited equally from 1990s. Poverty has declined most amongst the employed and self-employed, particularly employees in the private sector. In contrast, poverty appears to have increased in the economically inactive, the uneducated and in the household with large numbers of dependents.
Poverty levels are strongly related to education. Over half of the individuals in households where the head has no education are poor, compared to household where the head has been above primary school level.
This poverty trends has shown that households with a large number of members, and a large number of dependants, have high levels of poverty, as do household with a head who is economically inactive. Households that depend on agriculture also have high levels of poverty; amongst these, those that depend on the sale of livestock are particularly likely to be poor.
Conclusions
Poverty reduction efforts in Itilima District Council are guided by various medium and long term development policy frameworks and strategies including the Tanzania Development Vision 2025, describes the kind of society Tanzania envisages in the year 2025, -a society characterized by high quality livelihood, good governance and rule of law, and a strong competitive economy. The vision identifies the broad areas of focus which underpin other medium term policies and strategies in the country, the National Strategy for Growth and Reduction of Poverty (MKUKUTA in Swahili), the National Millennium Development Goals (2015), Ruling party manifesto (2010-2015 CCM Manifesto) and other directives from the higher government leaders.
POVERTY TRENDS IN ITILIMA DISTRICT COUNCIL
Itilima District Council has 66 Associations namely: - 15 Sacco’s, 44 Crop Associations, 6 Livestock keepers Association and 1 processor Association (Ginneries).
ASSOCIATIONS
CHAPTER FIVE
Most of the water sources are seasonal and depend on the amount of rains that falls. On the other hand the hand dug well also depends on the rains. With few rains in the season you get less water or the wells completely dry up during the dry season.
Unreliable water supply:
The new piped schemes working do not work to their full capacity due to lack of funds for operational and maintenance.
Operational Costs:-
Water contamination:-- These traditional water sources are not well protected, therefore sometimes the people share with animals and at the same time the people themselves bath and wash clothes near these water sources especially the dams/charcoal and river sources.
Basically as already mentioned, more than 48% of the people in the Council depend on traditional water sources as their major source of water supply. Acute water problems facing the people in Itilima District Council include the following:
4.3.4 Problems Facing Rural Water Supply
The main objective of having improved sanitation facilities is to enhance the impact of improved water sources so as to maintain the health status of the Communities.
The problem of water pollution in this Council is caused by various factors particularly less use of latrine.
| S/No
|
Type
|
Number
|
Percentage (%)
|
| 1.
|
Number of Households
|
35,711
|
|
| 2.
|
Households with any form of Latrine
|
20,238
|
56.7
|
| 3.
|
Households with Improved latrine
|
3,462
|
9.7
|
| 4.
|
Households with Sharing Latrines
|
3,952
|
11.1
|
| 5.
|
Households Without Latrine
|
7,411
|
20.8
|
| 6.
|
Households with Public Latrine
|
648
|
1.8
|
| 7.
|
Number of Households connected to sewerage facilities
|
N/A
|
0
|
SEWAGE AND SANITATION
| Na.
|
Title
|
Number
|
| 1
|
Engineer II
|
1
|
| 2
|
Principal Tech.
|
2
|
| 3
|
Senior Technician
|
0
|
| 4
|
Technician I
|
0
|
| 5
|
Assistant Technician
|
1
|
Number of staff establishment of water supply personnel
| No
|
Type
|
Rural water Supply
|
| 1.
|
Pumping
|
2
|
| 2.
|
Boreholes (dip wells)
|
8
|
| 3.
|
Shallow wells
|
476
|
| 4.
|
Dams
|
2
|
| 5.
|
Reserve (malambo)
|
25
|
| 6.
|
Water tanks
|
29
|
| 7.
|
Number of water user groups (WUGs)
|
476
|
| 8.
|
Operation and maintenance accounts (O & M)
|
476
|
| 9.
|
Water supply coverage (%)
|
51.3
|
Rural Water Supply
WATER SUPPLY AND SANITATION
To submit special request to the government to allocate the budget which will curb the real situation.
To make budget reallocation of 2013/2014 by December,2013 in regard to the priority of Laboratories construction.
Stratagies to combat Challengies.
Little fund provided from the Central government.
Droughts that has affected community contribution.
Challenges encountered:
The District through its District Councils will use its own source of income and Central government Grant to construct 3 laboratories in each school. First step is construction of laboratories foundation Completed by February 2014.Community will contribute the construction of walls of the laboratories, District councils through its own source together with sponsors/Donors contribution will complete the construction laboratories in secondary schools by 2014.
Laboratories Construction Strategies.
| Type of building
|
Required
|
Available
|
Shortage
|
% of shortage
|
| Itilima District council
|
||||
| Classrooms
|
142
|
138
|
4
|
2.8
|
| Administration Block
|
22
|
22
|
0
|
0
|
| Teachers Houses
|
186
|
66
|
120
|
64.5
|
| Laboratories
|
66
|
7
|
59
|
85.5
|
TABLE NO. 8: SITUATION OF SEC. SCHOOLS BUILDING CONSTRUCTION.
The Itilima District Council has taken different measures to strengthen the availability of secondary schools infrastructure including community participation.
CONSTRUCTION OF SECONDARY SCHOOLS BUILDINGS.
| Number of schools
|
Number of teachers
|
||||||||||
| GO’MENT
|
PRIVATE
|
TOTAL
|
REQUIRED
|
AVAILABLE
|
TOTAL
|
||||||
| M
|
F
|
||||||||||
| Itilima District Council
|
|||||||||||
| 22
|
0
|
22
|
293
|
155
|
31
|
186
|
|||||
|
|
|
|
|
|
|
|
|
|
|
|
|
NUMBER OF SEC.SCHOOLS AND TEACHERS.
|
|
Male
|
Female
|
Total
|
| Itilima DC
|
3,730
|
1,784
|
5,514
|
The Council has 22 government secondary schools. Schools has a total number of 186 teachers,where 155 are male and 31 female teachers.There are also 5,514 students as in the table below
SECONDARY SCHOOL


DED - ITILIMA
Sanduku la Posta: 308 BARIADI
Simu: +255 28 29 863 29
Simu: 028 29 863 28
Barua Pepe: info@itilimadc.go.tz
Hatimiliki ©2016 Kitengo cha TEHAMA. Haki Zote Zimehifadhiwa